Top 5 Price Action Patterns Every Trader Must Know (With Chart Examples)
Table of Contents
-
What Is Price Action Trading?
-
Why Learn Price Action Patterns?
-
Top 5 Price Action Patterns You Must Master
-
Pin Bar
-
Engulfing Pattern
-
Inside Bar
-
Fakey Pattern
-
Double Top & Double Bottom
-
-
How to Practice Price Action Trading
-
Common Mistakes with Price Action
-
FAQs
-
Final Thoughts + CTA
What Is Price Action Trading?
Price action trading is the art and science of making trading decisions based on the price movement itself, without relying heavily on indicators. It involves reading candlesticks, chart formations, and market structure to predict future movements.
Traders focus on support/resistance, trendlines, price patterns, and candle behavior to execute trades. It’s one of the most pure and powerful forms of technical analysis.
Visual Example: A simple clean candlestick chart with support/resistance marked clearly.

Why Learn Price Action Patterns?
Understanding price action allows you to:
-
Trade with clarity instead of relying on lagging indicators.
-
React to real-time price behavior.
-
Apply it to any market (Forex, Stocks, Crypto).
-
Build a solid foundation for any trading strategy.
Price action is timeless. No matter what tools or bots you add later, this will always be your core edge.
Visual Example: Compare an indicator-heavy chart vs. a clean price action chart.
Top 5 Price Action Patterns You Must Master
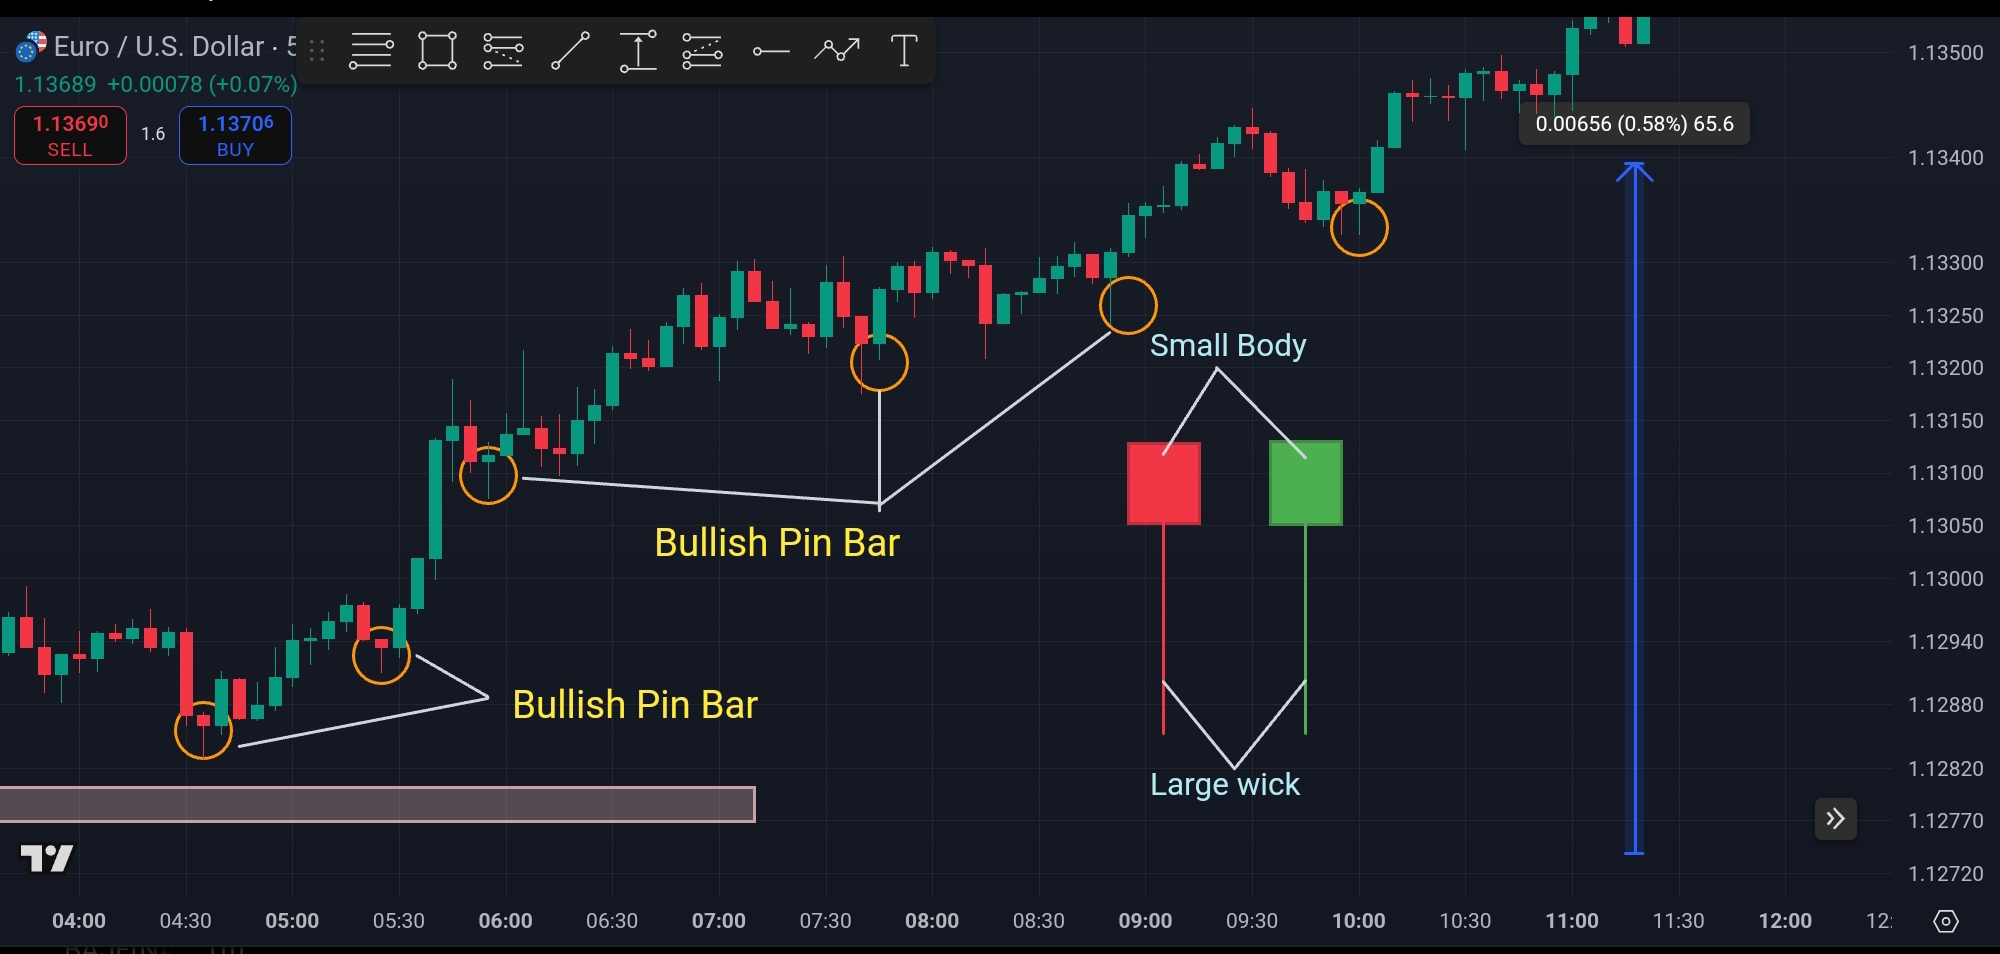
1. Pin Bar – Master of Rejection
A Pin Bar (aka Pinocchio Bar) is a single candle that signals a strong rejection of price at a key level.
-
Bullish Pin Bar: Long lower wick, small body on top — suggests buyers took control.
-
Bearish Pin Bar: Long upper wick, small body on bottom — sellers took over.
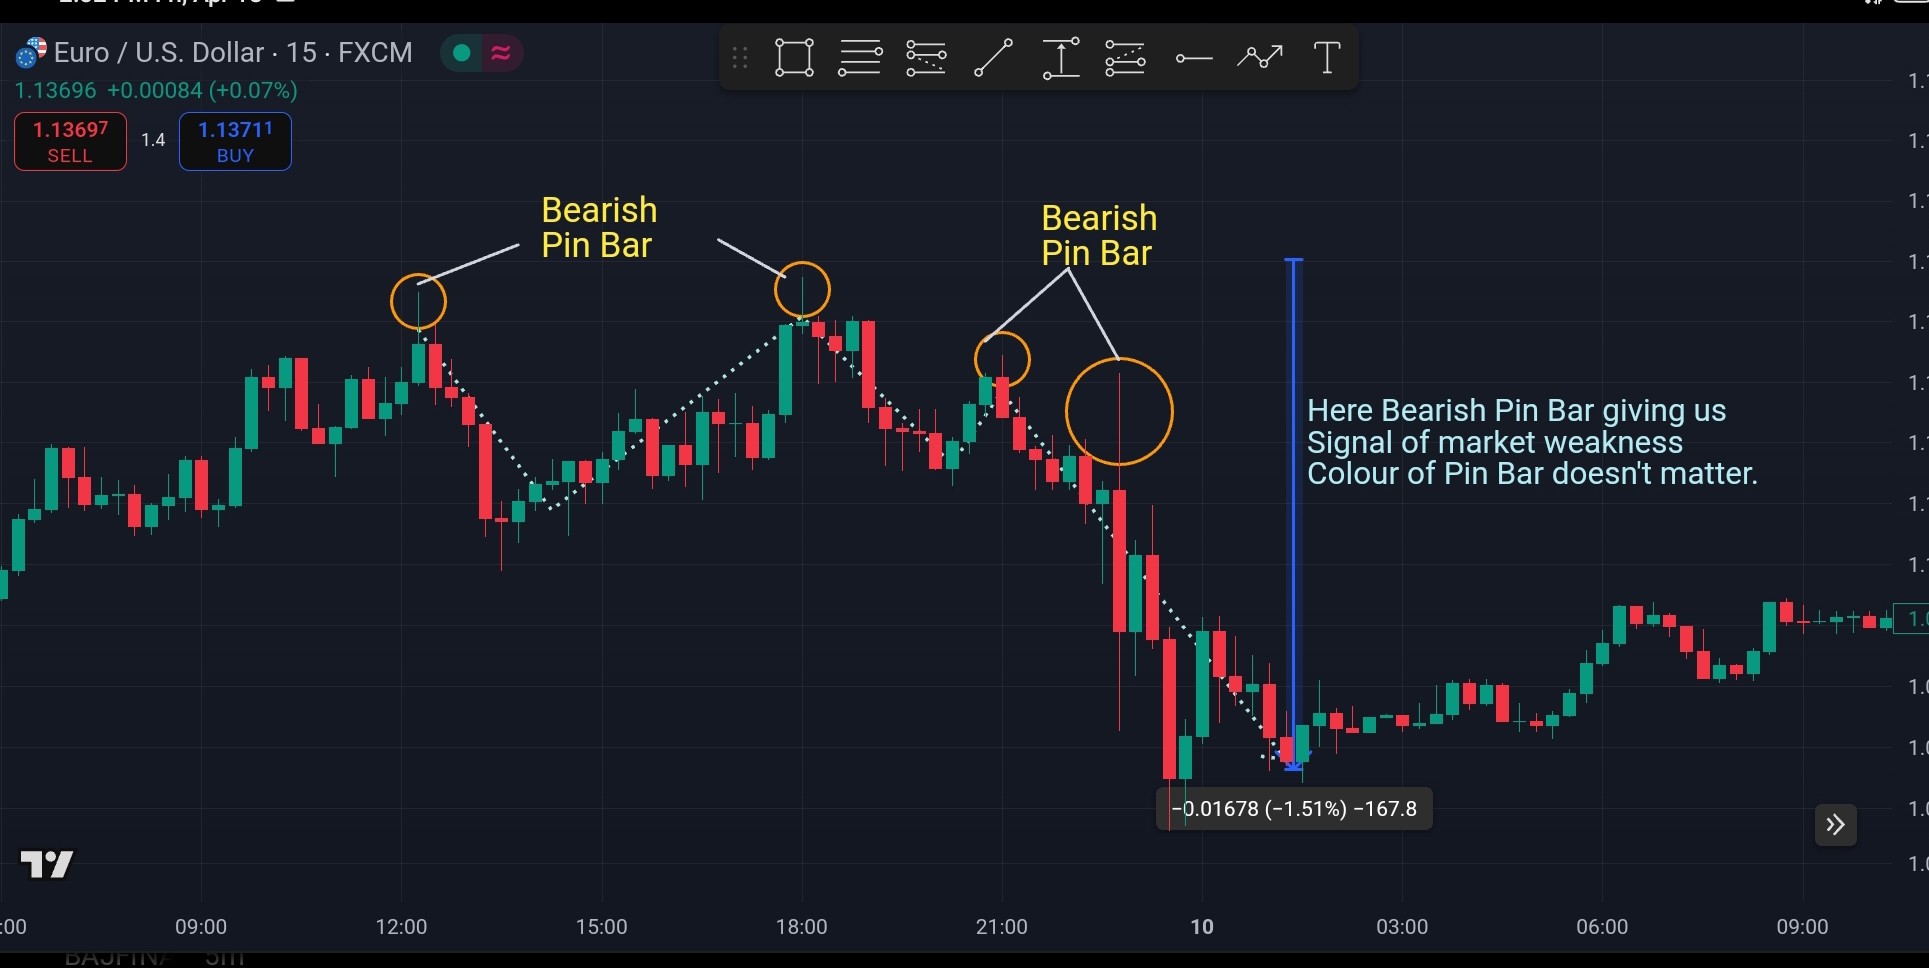
Best Used: At support/resistance, trendline bounces, or Fibonacci level
Visual Example: A highlighted pin bar at resistance with the next candle confirming a bearish move.
2. Engulfing Pattern – Reversal Beast
An Engulfing Pattern involves two candles. The second candle fully engulfs the previous one, indicating a powerful shift in sentiment.
-
Bullish Engulfing: Red candle followed by a large green candle.

-
Bearish Engulfing: Green candle followed by a large red candle.

Visual Example: A bullish engulfing pattern forming after a short downtrend and triggering a rally.
3. Inside Bar – Calm Before the Storm
An Inside Bar forms when the entire candle fits within the high-low range of the previous candle. It signals consolidation, often followed by a breakout.
-
Works great in trending markets or near breakout zones.
-
Combine with trendlines or continuation zones for best results.
Entry Tip: Place buy stop above or sell stop below the mother candle.

4. Fakey Pattern – Trap and Reverse
The Fakey Pattern starts as an inside bar breakout, but then price quickly reverses — trapping traders.

-
Why it works: It reflects market manipulation or smart money traps.
-
Use this to trade against false breakouts, especially near major zones.
5. Double Top & Double Bottom – Classic Reversal Patterns
These are old-school but gold. They form when price hits the same support/resistance level twice and fails to break through.
-
Double Top: Price makes two peaks and reverses lower.

-
Double Bottom: Price makes two lows and reverses higher.

Key Confirmation: Wait for the neckline break for entry.
Visual Example: A double top pattern with neckline break and retest.
How to Practice Price Action Trading
Reading blogs isn't enough. You need real chart time to master price action.
Practice Action Plan:
-
Open a free TradingView account.
-
Use the Bar Replay Tool to go back in time and practice spotting patterns.
-
Screenshot examples of each pattern from live charts.
-
Keep a journal of outcomes.
-
Use a demo account to practice entries and exits.
Helpful Resource: TradingView Bar Replay Tool
Common Mistakes with Price Action
Avoid these common pitfalls:
-
Trading patterns in low volume or sideways markets.
-
Ignoring context and trend.
-
Jumping in before confirmation.
-
Not combining with key zones or market structure.
Price action is not just about patterns — it's about reading the story behind the candles.
FAQs
Q1: Can I trade price action without indicators?
Absolutely. Many pros use just price, zones, and structure — and outperform.
Q2: Is price action suitable for beginners?
Yes. It trains your eye and discipline early.
Q3: What’s the best timeframe for practicing price action?
Start with 1H or 4H for cleaner patterns and move to 15m/5m as you gain experience.
Final Thoughts + CTA
If you're serious about becoming a profitable trader in 2025, price action patterns should be your daily study material. These 5 patterns will help you:
-
Time entries better
-
Avoid false signals
-
Read the chart like a pro
But only if you practice them deliberately.
Next Read: The Last Trading Guide You’ll Ever Need
Call to Action:
Start practicing these patterns today. Subscribe to Profits Vista for more in-depth trading lessons, free chart breakdowns, and trading psychology content every week.
Plz leave your comments if have any queries about market!
Comments
Post a Comment